General remarks
Post-processed satellite data with filled gaps and validation scores to indicate the uncertainty can be applied for climatological analysis of snow cover. In this module Baltic States are used as an example area. Annual and monthly snow cover days (SCD) were calculated for the region using MODIS data from 2000 to 2013. In this study, a day with snow was considered when snow cover depth at ground stations was at least 1 cm. Monthly and annual SCDs are used in climatological studies to represent the local and regional conditions and shifts in snow cover due to the climate change. In hydrology SCDs and snow depth are used to evaluate spring flood conditions, and in agriculture to evaluate soil water recharge potential.
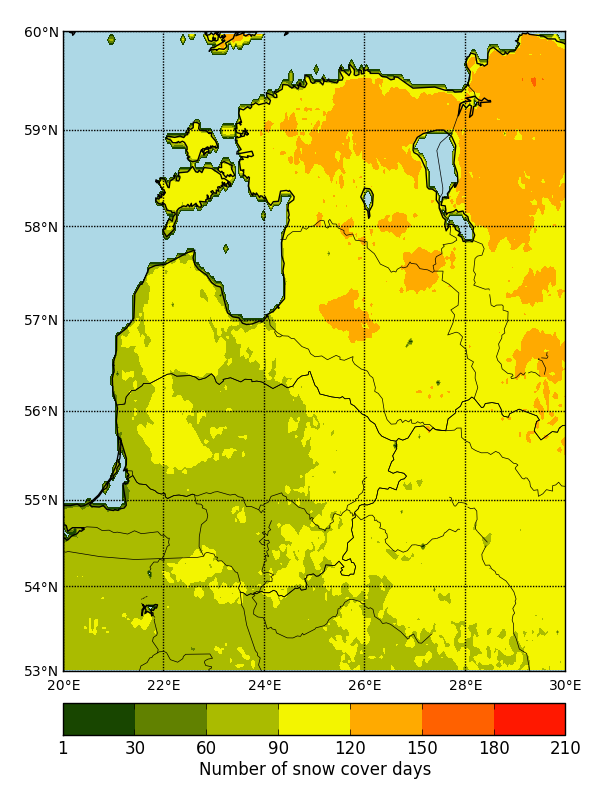
MODIS snow data composites suggest that the annual number of SCD varies from 30 days in the coastal regions of Lithuania and Latvia to 180 days in the north of Estonia (Fig. 1).

Figure 1: Average annual number of snow cover days in the Baltic states, 2000-2013. Derived from MOD10C1 product.
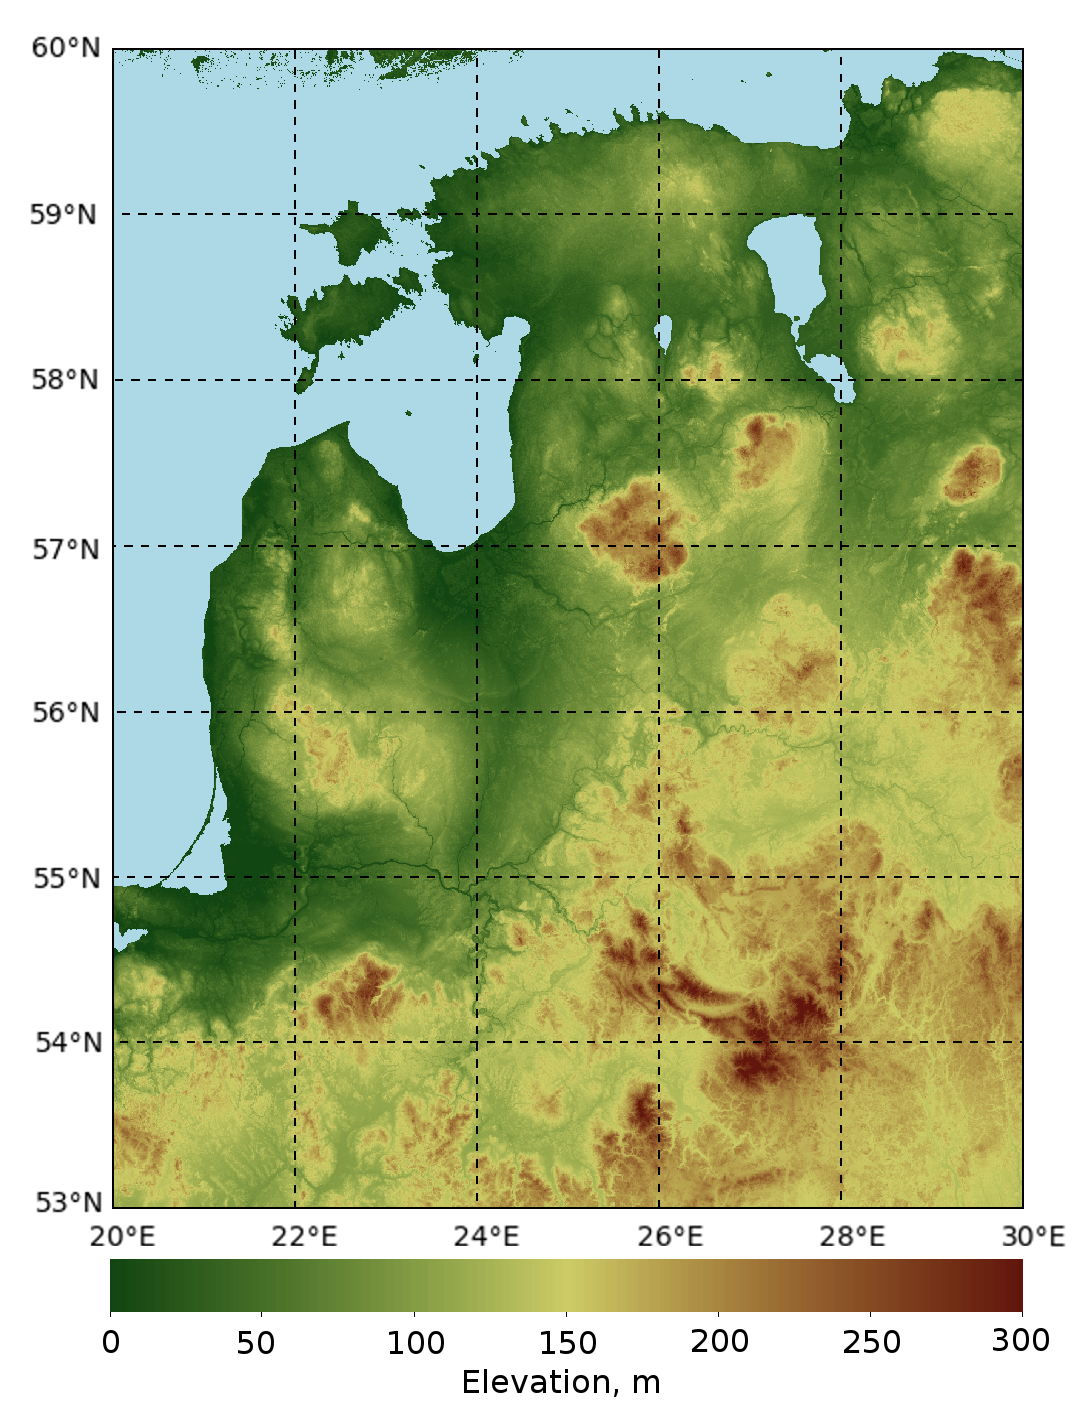
In Figure 2 it is clear that satellite-based SCD reflect the topography of Baltic States. The number of snow cover days in the region increases from west to east, as the climate becomes more continental. On a smaller scale, SCD occur more often at higher elevations than in lowlands. SCD maps based on in-situ data cannot match satellite-derived products in the detail of spatial information because of the limited number of in-situ observations. Spatial coverage is one of the main advantages of satellite-based climatology. Remote sensing of snow in mountainous areas is more challenging because of the complex topography and often very complex land cover patterns.
|
|
Figure 2: On the left: climatological mean of snow cover days derived from MODIS data. On the right: digital elevation model of the Baltic States. The spatial distribution of snow cover days reflects the transition from maritime to continental climate as well as topography; higher elevations have more snow.