EXERCISE
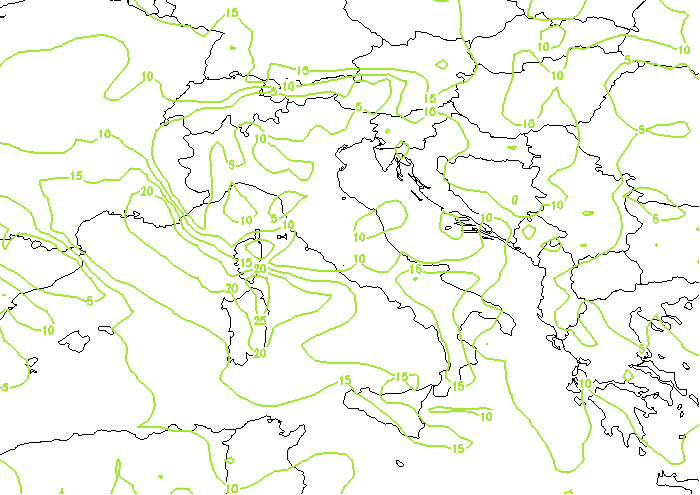
In synoptic practice many cases can be found in which a feature is totally missing or not being clear enough on pressure-level charts whereas the same feature is clearly seen in the cross section. Besides, there are also features which can only be detected in vertical cross sections, such as temperature inversions, vertical wind sheer etc.The example here is showing several charts of isotachs (wind speed isolines) on pressure levels. Look at the wind field on pressure levels and try to find at which level is the jet streak (the region of maximum wind speed) located above Italy?
|
|
09 February 2006, 00 UTC - 850hPa wind field.
|
|
|
QUESTION :
At which pressure level is the maximum wind over Mid-Italy located? Select the correct level:
- 850 hPa
- 700 hPa
- 500 hPa
- 300hPa
- 200 hPa
- 100 hPa
Answering the question is much easier if you look at the cross-section! You can see it in a glance! This gives you the first impression about usefulness of the cross sections.