Cross sections of various meteorological parameters
Although the cross-sections of the isentropes can give very useful information about the state of the atmosphere, there are other very useful parameters that give additional input for the analysis. Every meteorological parameter that can be analyzed on isobaric surfaces, can also be analyzed in the cross-sections and in many cases such analysis gives a lot of information, not visible from analysis on isobaric levels.
The examples on this page will show time cross-sections instead of the space cross-sections. The idea is the same, only the horizontal axis of the cross-section is not space but time, therefore the cross-section shows the changes of a certain quantity over a certain time-span and not over some geographical region.
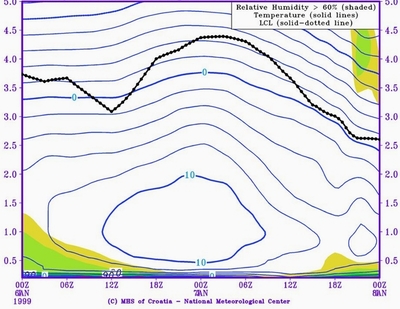
| TEMPERATURE Cross-section of temperature, for example, can give the idea where temperature inversions are located and also where the gradient of temperature is the strongest. An example here shows a large inversion layer in the middle of the cross-section, between ground and 2km height. This is a time-cross section, so according to this it is expected that the inversion would form in the afternoon hours and persist until noon next day. This kind of information given by temperature cross-section is very useful in forecasting fog, for example. |
 |
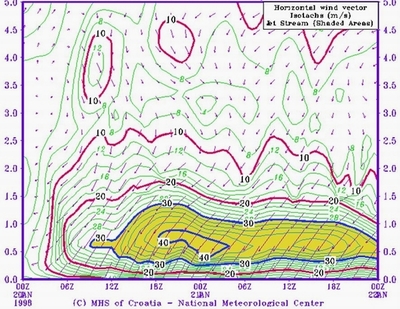
| WIND Cross-section of wind gives the location (height) of the jet streak, but in some cases, as in this example, it is very useful for locating low level jet or the region of very strong wind in the lower tropopause. This example here shows that the model forecast the maximum of the north-easterly wind up to 40 m/s in the layer from the ground to about 1.5 km height. This is the situation with very strong Bora wind which blows on the Croatian coast of Adriatic Sea. Situations like this one occur several times a year! Since this is a time cross-section it can be concluded that this very strong wind will persist for two whole days! |
 |
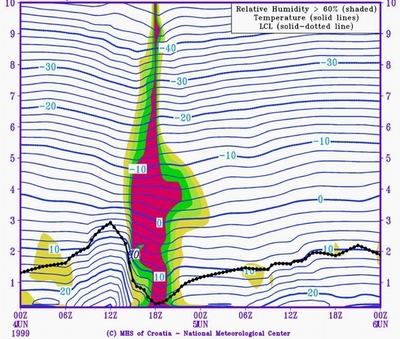
| RELATIVE HUMIDITY Cross-section of relative humidity shows the distribution of humidity in the vertical. In the example here it is the case of intensive convection with high humidity levels reaching up to the top of the troposphere. This is also a very nice example showing strong temperature changes connected to this convective development which are clearly visible in the lower 2 km, but also in higher troposphere in form of tropopause folding. |
 |
Many other parameters could be discussed here but it is more useful to discuss the parameters connected to some typical systems or features, which will be dealt with in the next chapter of special features.