Cross sections in meteorology - basics
In everyday synoptic practice meteorological parameters are usually computed and analysed on isobaric surfaces. However, the disadvantage of such a working concept is the difficulty in combining the evaluation results of single levels vertically.Here is where vertical cross sections come in!
In weather analysis and forecasting cross section is a graphic representation of a vertical surface in the atmosphere, along a given horizontal line or path, extending from the earth's surface to a given altitude. In other words it's a vertical slice of the atmosphere between two endpoints.
It gives a view into the vertical distribution of different parameters, therefore allowing a new understanding of the processes taking place in the troposphere. The type of data and analysis presented on such a cross-sectional chart depends upon its purpose. In meteorology, a synoptic cross section is prepared from synoptic weather data. In aviation, a flight cross section (or route cross section) is a graphic forecast of conditions expected to be encountered along the proposed flight route, etc.
Together with satellite images and meteorological quantities displayed on horizontal levels, cross sections make a fundament of the 3-D analysis of the atmosphere.
Here you can see an example of a case analysis where standard meteorological quantities, in this case RELATIVE HUMIDITY, are displayed on pressure levels.
|
|
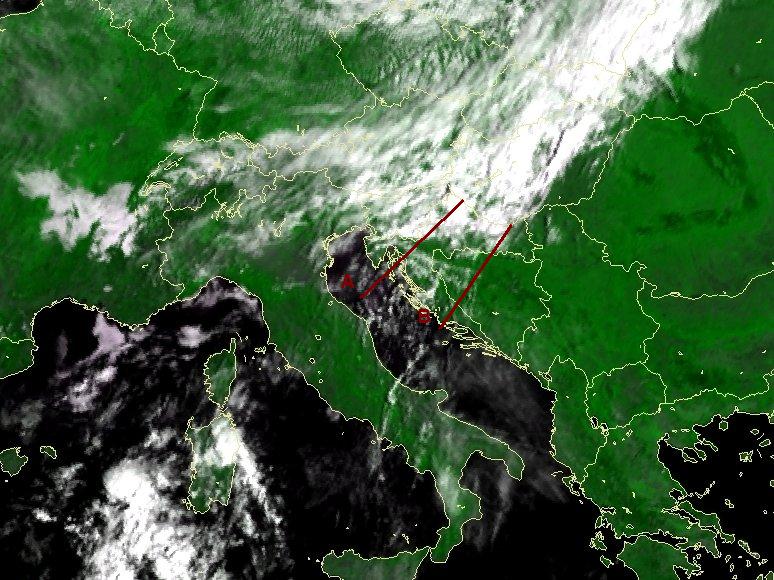
Satellite image showing the humidity in form of clouds.
|
You would now need a lot of brain processing to picture yourself what the distribution of humidity looks like in the vertical. Cross sections like these along lines A and B , make it much easier!
You can see another example of the benefits of the cross section in the following EXERCISE.